Introduction
Most “security tools” today are typically composed by code that consumes an API and applies predefined logic to identify issues. This is generally accomplished by:
- Fetching a subset of the endpoints exposed by the service / API being audited (that is, the information required for the evaluation logic, such as a list of the EC2 instances deployed in an AWS account, as well as their configuration)
- Storing the data retrieved
- Evaluating this data to produce “findings” (this is the added value provided by the tool)
Integrating third party tools into our monitoring platform isn’t always straightforward, as each tool:
- Implements its own data storage structure, often in a custom format that facilitates analysis
- Uses an evaluation logic that’s not easily extended or exposes its logic
clearly
- e.g. generating findings whose metadata doesn’t explain why they are true positives
Additionally, tools are usually designed to only fetch the data that is determined to be useful at a point in time. Often this means fetching the data that’s required to evaluate the currently implemented findings. This approach severely limits how useful they can be in other contexts, for example, when conducting an incident response.
Motivated by the above limitations, we have taken a different approach in constructing our monitoring platform and in-house tools, which has come with several advantages. This blog post elaborates on our tooling development strategy, aiming to encourage the adoption of a similar approach in future tool developments across the security industry.
Our approach
Rather than fetching a subset of known-useful endpoints, we generalize the consumption APIs to capture all the available data, independently of its perceived value at a point in time. For example, this could mean making requests to every single endpoint of the GitHub API. This data is then stored in its original format, including both the request and response. Once the data is stored locally (we typically call this a snapshot), we can run queries against it, and build findings on top of these queries.
This approach presents a number of benefits:
- By not making assumptions about what data is useful, we can answer questions
beyond a predefined set of “security findings”.
- For example, we can answer questions such as “what are all the services in use” or “are any resources affected by a specific issue” in a way most tools can’t.
- This broadens the use of these tools to allow them to be used for exploratory work, providing us with a better understanding our clients' infrastructure and topology, without requiring constant/direct access to their systems.
- By storing full snapshots, we can query historical data, for purposes such
as:
- Historical analysis of environments (for example, “when did this get created?”), which is useful for incident responses.
- Analyzing historical data to identify which systems were previously affected by a newly published vulnerability.
- Answering questions such as “what host had this IP address two months ago”.
- Storing full snapshots facilitates a least privilege approach and decreases the amount of interaction that engineers need to have with live systems, since all the information we may need about an environment is stored in a snapshot.
- Using a query language (more on this later) rather than custom logic has a
number of advantages:
- Decouples the data from the analysis, which in turn improves forward compatibility.
- Allows for cross-domain queries and exploration.
- For example, bridging cloud and network data (our external network scans detected a vulnerable service, what EC2 instance has that IP?).
- Improves the understandability of finding logic.
- We can start monitoring new services immediately, even before we know exactly
what security issues we’re looking for.
- This is particularly important for large APIs/providers like AWS, because they are constantly adding new features and services.
- By comparison: other tools need to add support for a service manually, which may only happen months later - or never.
- By keeping the fetched data in its original state, we have the ability to simulate the original API (more on this later).
Let’s dig into some specifics.
Generating snapshots
We mentioned that we generalize the consumption of the API - what does this mean? Well, APIs follow a more or less strict format. If you can write some code that understands that format, then you can consume all of it with relatively little human intervention. Let’s look into the types of APIs we usually encounter.
Simple APIs
These are usually REST APIs, that may have some level of definition without having a formal specification. We consider these to be “simple” as there’s limited relationships between endpoints, which allows for relatively straightforward collection.
A good example of this are the APIs exposed by Kubernetes clusters. Clusters
expose /api & /apis endpoints, which detail the resources available in the
cluster in a RESTy manner. The Kubernetes cluster API is quite simple
(endpoints are self-contained and multiple requests aren’t required to fetch
resources), which allows using the /api and /apis endpoints to fetch all
the resources.
The following figure shows the process a tool could follow to consume a Kubernetes cluster’s API:

In the above, the first request discovers the available endpoints/resources, and the second one fetches the details for the cluster’s namespaces. Following this process for all the resources returned by the initial request would allow consuming all the data exposed by the API.
Formal APIs
These are APIs that publish definitions based on standards such as Open API or
GraphQL. Going back to the Kubernetes API example, in addition to the /api
and /apis endpoints, clusters also expose a /openapi/v2 endpoint which
provides an Open API specification. Making an API request to this endpoint
returns information similar to what we saw previously:
{
  "swagger": "2.0",
  "info": {
    "title": "Kubernetes",
    "version": "v1.25.3"
  },
  "paths": {
    "/api/v1/": {
      "get": {
        "description": "get available resources"
      }
    },
    "/api/v1/namespaces": {
      "get": {
        "description": "list or watch objects of kind Namespace",
        "responses": {
          "200": {
            "description": "OK",
            "schema": {
              "$ref": "#/definitions/io.k8s.api.core.v1.NamespaceList"
            }
          },
          "401": {
            "description": "Unauthorized"
          }
        },
        "x-kubernetes-action": "list",
        "x-kubernetes-group-version-kind": {
          "group": "",
          "kind": "Namespace",
          "version": "v1"
        }
      }
    }
  }
}
While the format is different, the complexity of parsing this information remains low. Things change significantly when there are relationships between the different endpoints. For example, to retrieve the details of all the repositories in a GitHub organization using the public REST API, you’d need to make two API calls:
https://api.github.com/orgs/<organization>/reposto get a list of repositories in the organizationhttps://api.github.com/repos/latacora/<repository>to get the details for a given repository
To accomplish this automatically, you’d need to consume the API’s definition and use it to build a relationship graph, which defines the endpoints that return data that needs to be used as input for other endpoints. This looks something like this:

Complex APIs
These are APIs that don’t publish definitions or don’t have a consistent behavior. They also tend to have very loose conventions, with frequent exceptions. A good example of this is AWS, where each service has its own set of endpoints, and these endpoints follow differing structures. To further complicate things, AWS API endpoints have considerable, and sometimes complex, relationships.
For example, to identify EC2 instances that have instance profiles with IAM policies that grant administrative level permissions, you’d need to call the following API endpoints:
- EC2
describe-instancesto list the EC2 instances and get the profiles attached to each of them - IAM
list-instance-profilesto get the IAM role attached to each instance profile - IAM
list-role-policiesto get the IAM inline policies attached to each role - IAM
get-role-policyto get the policy documents for the IAM inline policies - IAM
list-policiesto get the IAM managed policies - IAM
get-policy-versionto get the policy documents for the IAM managed policies - IAM
list-entities-for-policyto identify which of those policies are attached to each IAM role
The call graph would look something like this:

While the complexity of the call graph is similar to the GitHub API example above, AWS does not publish a definition of its APIs across all services in a convenient location. Supporting these APIs requires more human intervention compared to simple or formal APIs. But, for high-value APIs such as AWS, the effort involved is definitely worth it; where else can you get the details of everything deployed in an account!
Querying snapshots
As mentioned above, both our investigation and “findings” logic leverage query languages rather than custom logic. At Latacora, our primary programming language is Clojure, and the main technologies we use to query snapshots are Datalog with Datascript and Specter.
Thanks to our choice of query language, which is both expressed as structured data and intrinsically supports expanding “functions” (via Predicate Expressions), we can also express complex logic with simple helpers. What does this look like? Well, let’s say we want to write a query that returns all AWS EC2 instances that have the IMDSv1 enabled1. The Datalog query would look something like this:
(require '[datascript.core :as d])

(pqd/q '[:find  ?instance-id ?vpc
         :keys  instance-id vpc
         :where (aws-call "ec2" "describe-instances" ?api)
                [?api :reservation ?reservation]
                [?reservation :instance ?instance]
                [?instance :instance-id ?instance-id]
                [?instance :vpc-id ?vpc]
                [?instance :metadata-option ?metadata]
                [?metadata :http-tokens "optional"]
         :in $ %]
       db)
In the above:
dbis the Datascript database generated from the snapshotaws-callis a helper function that pulls a specific API call from the db- The rest of the
:whereclause implements the query logic, in this case against the describe-instances data structure - The
:keysdefine the fields that should be returned by the query
Another example would be identifying every API call (i.e. path in the snapshot) where a specific IP address appeared. Here Specter would be our tool of choice. A simple query like this one would suffice:
(require '[com.rpl.specter :as specter])

(def path-finder
  "Finds the first entry matching `pred` in a deeply
  nested structure of maps   and vectors, and collects
  the path on the way there."
  (specter/recursive-path
    [term-pred] p
    (specter/cond-path
      (specter/pred term-pred) specter/STAY
      map? [INDEXED p]
      coll? [INDEXED-SEQ p])))

#(specter/select (path-finder (fn [val] (.equals "1.3.3.7" val)))
                 snapshot)
In the above, snapshot is the snapshot loaded into a map.
These are just a few examples of the data manipulation we perform routinely against snapshots. Since the tools are not tied to the underlying data structure being queried, they can be changed at any time, or more adequate tools can be used for specific tasks (e.g. we love using Meander for data transformation).
Replaying snapshots
While we’re very proud of our in-house tooling, other excellent tools exist that implement useful functionality which we want to use, such as generating visual representation of cloud environments. While we could implement these same things (and we sometimes do), it would require a lot of work with limited added benefit. We’d rather allow these tools to run against the snapshots, instead of the actual APIs.
That way, we’d:
- Benefit from new tools with no additional effort
- Be able to run these tools against historical data
- Minimize the impact (i.e. API queries) that these tools can have on API
quotas, as we’d only need to run the API collection code against the real
APIs
- This also minimizes the time it takes to run these tools by removing most of the network latency involved in making thousands of remote API calls, since we only need to do that once
Since we’ve pulled all the information out of the provider, we have the ability to “play back” this information by faking an API endpoint that returns the information in the same format it was originally ingested in. This isn’t always trivial (and in some cases quite impractical), but it’s definitely a strategy we’ll want to implement more broadly in the future.
Tying it all together
Good tooling is useless if you don’t have a means of proactively reacting to its findings. At Latacora, we’ve built a scheduling, reporting and alerting pipeline that integrates all of our tools. At a high level, it looks something like this:
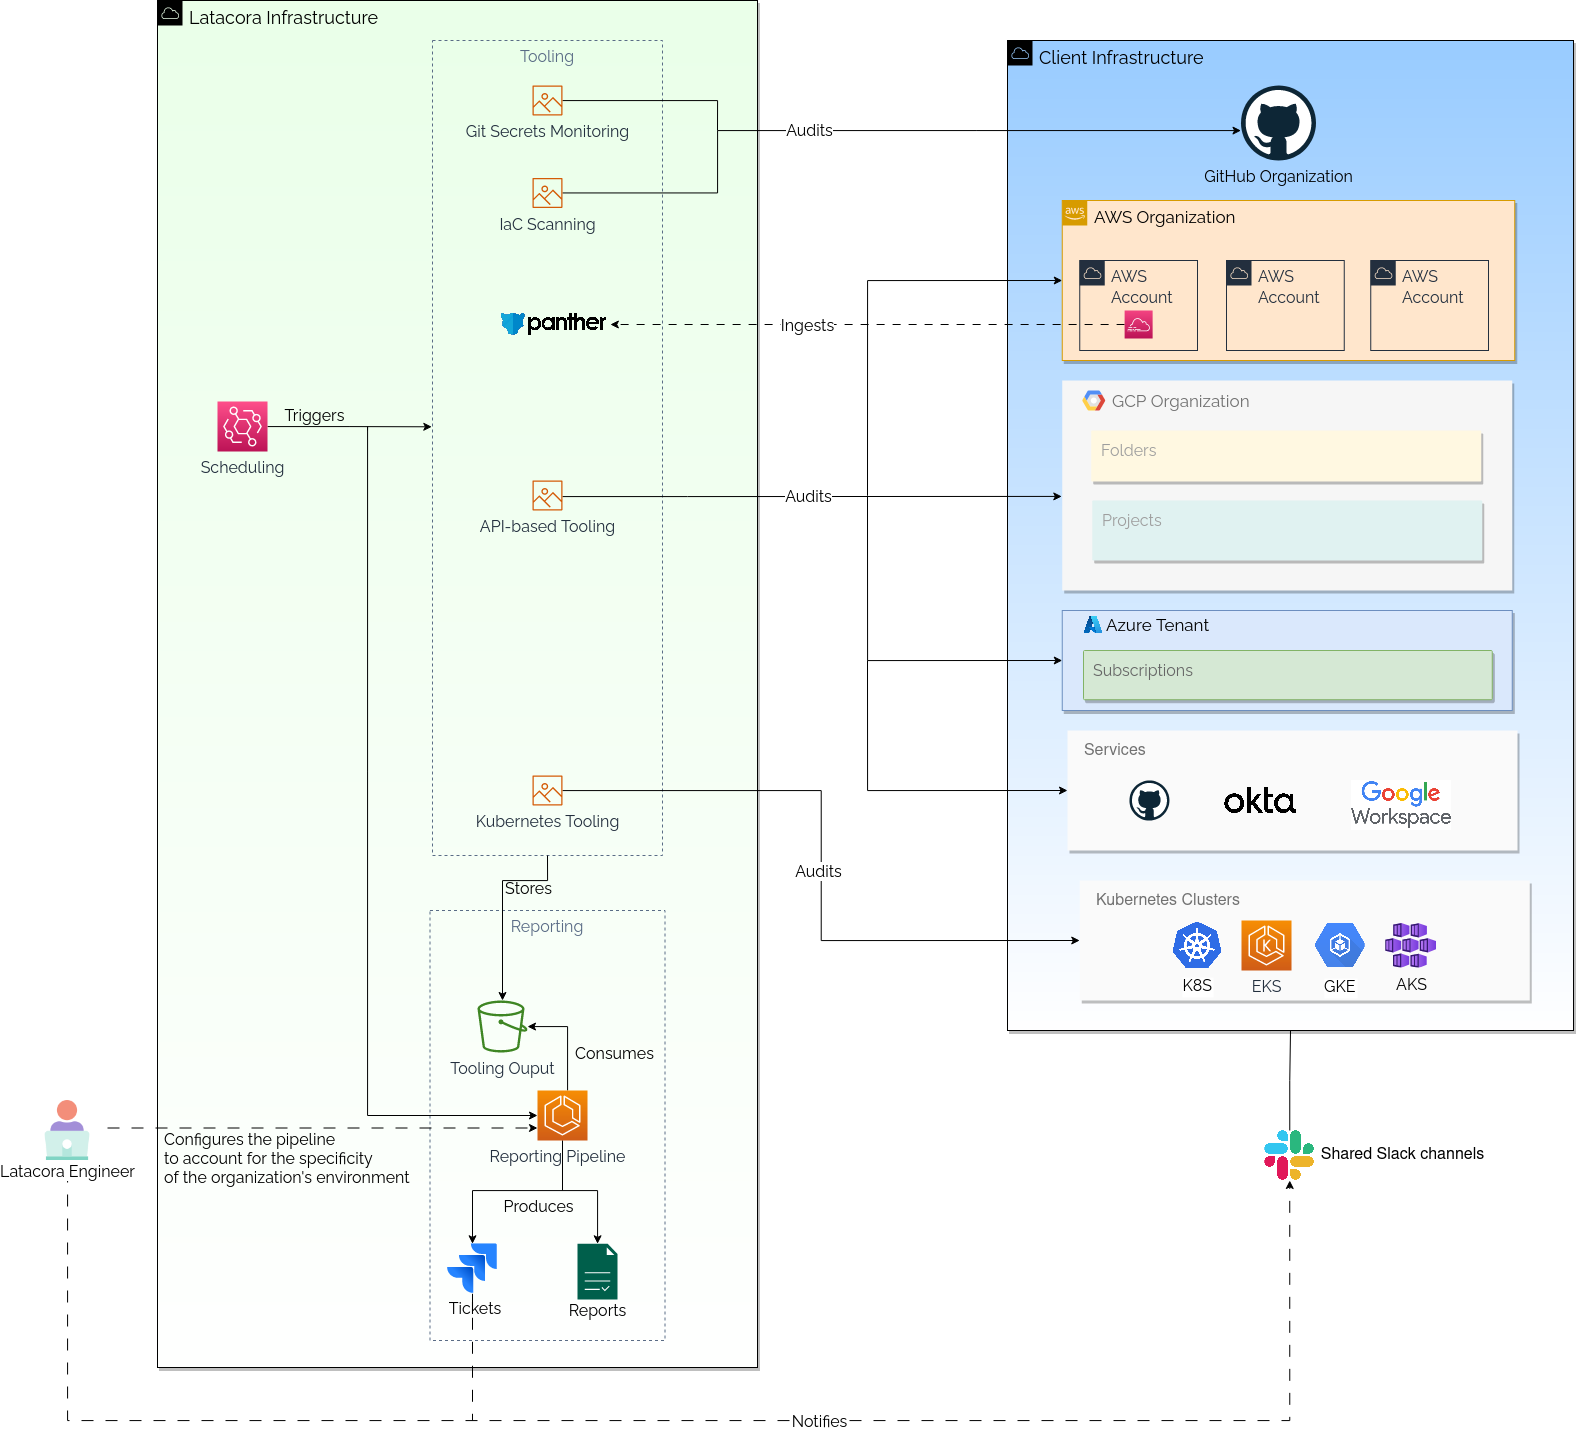
The “reporting pipeline” is the central piece of our persistent monitoring capability. It ingests daily tooling output and not only does it generate point-in-time reports we share with our clients, it also creates JIRA tickets for things that need to be validated by an engineer, and potentially escalated to the impacted organization.
A specificity of this reporting pipeline is the approach we take to modeling our knowledge of our clients’ infrastructure and applying it to the tooling output. Once again, we take a generalist approach and describe the logic as Clojure code. This logic can be divided into two “models”:
- A general model that represents our Cloud security expertise in a way that applies to all organizations. For example, we have logic that matches multiple findings together to identify misconfigurations that need to be prioritized. This could include things like EC2 instances that have IMDSv1 enabled and have instance profiles with administrative level permissions.
- A client-specific model that represents our knowledge of the organization’s
infrastructure, e.g. by:
- Increasing the risk rating of findings that appear in sensitive AWS accounts
- Ignoring resources that are expected to be publicly accessible based on a set of predefined parameters
As these models are code, they can be overlapped to our tooling output, which results in an accurate representation of the environments’ overall security posture.
Conclusion
We hope this blog post has provided valuable insights to security tool developers and has inspired a shift in the way they approach tooling development. If you have any questions or would like to get in touch, you can reach out at hello@latacora.com.